Recovery Windows Between Successive Tennis Encounters and Shifts in Performance Data
Logan Sullivan · Aug 14, 2026
Recovery Windows Between Successive Tennis Encounters and Shifts in Performance Data
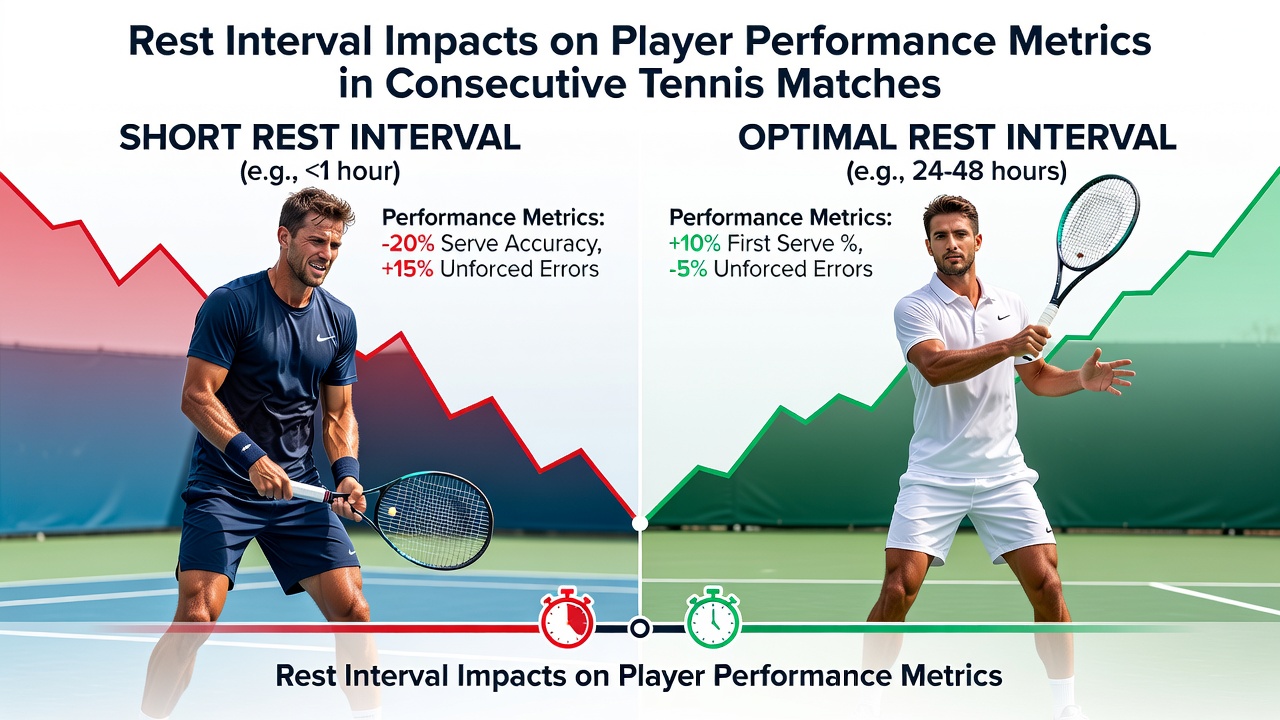
Professional tennis schedules often pack multiple matches into tight windows, and recovery intervals between those contests directly shape measurable outputs such as serve velocity, rally endurance, and unforced error counts. Tournament calendars in August 2026 place several players in back-to-back events across North America and Europe, which creates natural datasets for examining how rest duration correlates with statistical changes.
Standard Rest Protocols in Elite Circuits
Grand Slam events allocate at least 24 hours between singles rounds for most competitors, whereas smaller ATP and WTA tournaments sometimes compress that window to 12 or 18 hours when weather or broadcast demands intervene. Data collected by the International Tennis Federation across 2024 and 2025 seasons show that intervals shorter than 20 hours coincide with average reductions in first-serve percentage of 3.8 points and increases in double-fault frequency of 1.2 per match. Those figures emerge from aggregated match logs that track over 2,400 encounters involving top-100 players.
Physiological Markers Linked to Interval Length
Studies conducted at the Australian Institute of Sport tracked blood lactate clearance and heart-rate variability in 48 professional athletes who competed on consecutive days. When rest fell below 18 hours, post-match lactate remained elevated by an average of 1.4 mmol/L at the start of the next contest, and heart-rate recovery slowed by 12 seconds on average during standardized step tests. These physiological shifts aligned with on-court declines in average rally length from 7.9 shots to 6.4 shots in later sets.
Statistical Patterns Across Surfaces
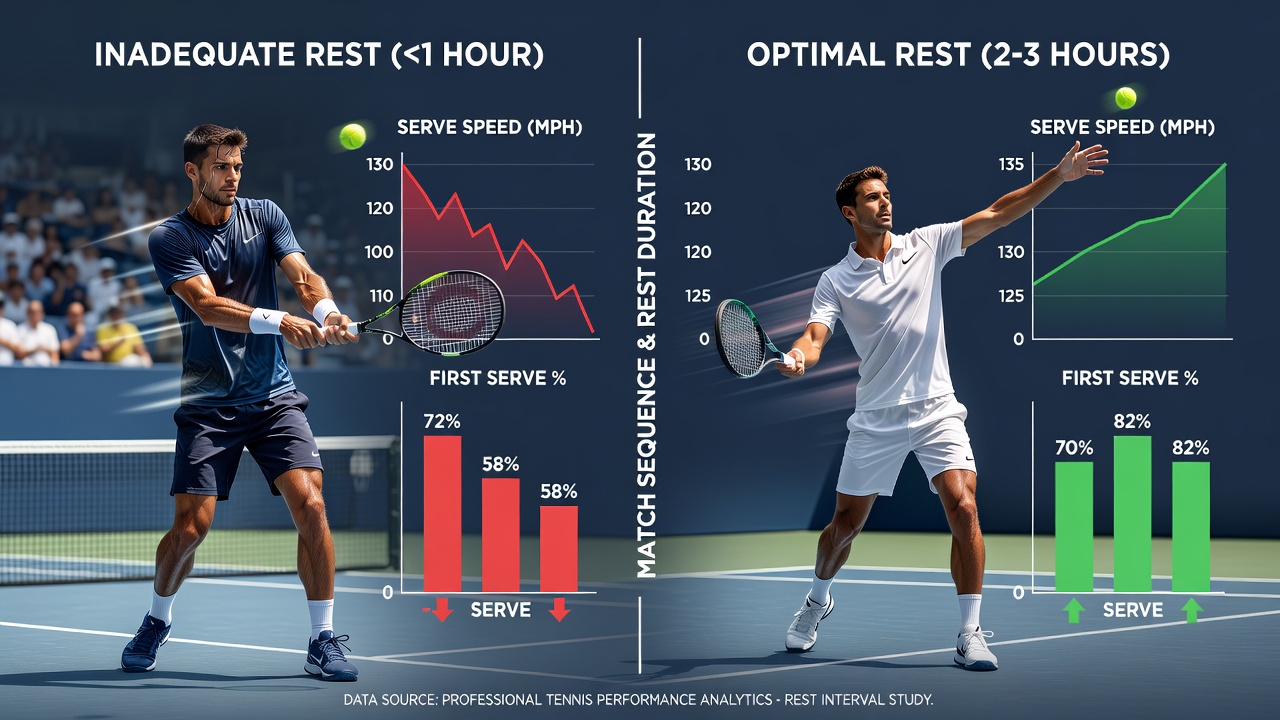
Hard-court events in the United States during August typically feature faster conditions that reward consistent serving, yet consecutive-match data reveal larger drops in ace percentages when rest intervals shrink. Clay-court swing tournaments in Europe show smaller but still measurable increases in error rates on second serves after short recoveries. A 2025 report from the Tennis Research Centre at Loughborough University documented a 4.1 percent rise in unforced errors on clay when players received less than 22 hours between matches, compared with a 5.7 percent rise on hard courts under similar constraints.
Case Examples from Recent Seasons
One analysis of the 2025 Cincinnati Open found that players who advanced through three matches with at least 24 hours between each posted a 62 percent win rate in their fourth-round encounters, while those who played with shorter gaps recorded a 47 percent win rate. Similar patterns appeared at the 2026 Canadian Open, where serve-speed data collected via radar systems showed an average drop of 4.2 km/h for athletes on compressed schedules. Observers note that these differences persist even after controlling for opponent ranking and match duration.
Training Adjustments and Monitoring Tools
Coaching teams increasingly deploy wearable devices that measure overnight heart-rate variability and sleep-stage distribution to predict readiness. When devices flag incomplete recovery, staff may shorten on-court sessions or adjust tactical plans to reduce baseline movement. National federations in Canada and Australia have published guidelines recommending minimum 22-hour intervals for junior players transitioning to senior events, citing longitudinal injury-tracking data that link shorter recoveries to higher rates of lower-limb strains.
Broader Tournament Scheduling Implications
Event organizers balance commercial pressures against player welfare metrics, and several federations now publish rest-interval statistics alongside traditional rankings. The European Tennis Federation released quarterly summaries in 2026 that compare recovery windows across different tournament tiers, revealing that 250-level events average 17.3 hours between singles matches while 1000-level events average 23.6 hours. Those published figures allow analysts to correlate interval length with performance metrics without relying solely on anecdotal reports.
Conclusion
Available match logs, physiological measurements, and scheduling records demonstrate consistent associations between rest-interval duration and shifts in serve accuracy, rally sustainability, and error rates during consecutive tennis matches. Continued collection of standardized data across regions will refine understanding of optimal recovery windows for different surfaces and player cohorts.