Penalty Decision Patterns Among Referees and Their Impact on Football Accumulator Bets
David Fischer · Jun 19, 2026
Penalty Decision Patterns Among Referees and Their Impact on Football Accumulator Bets
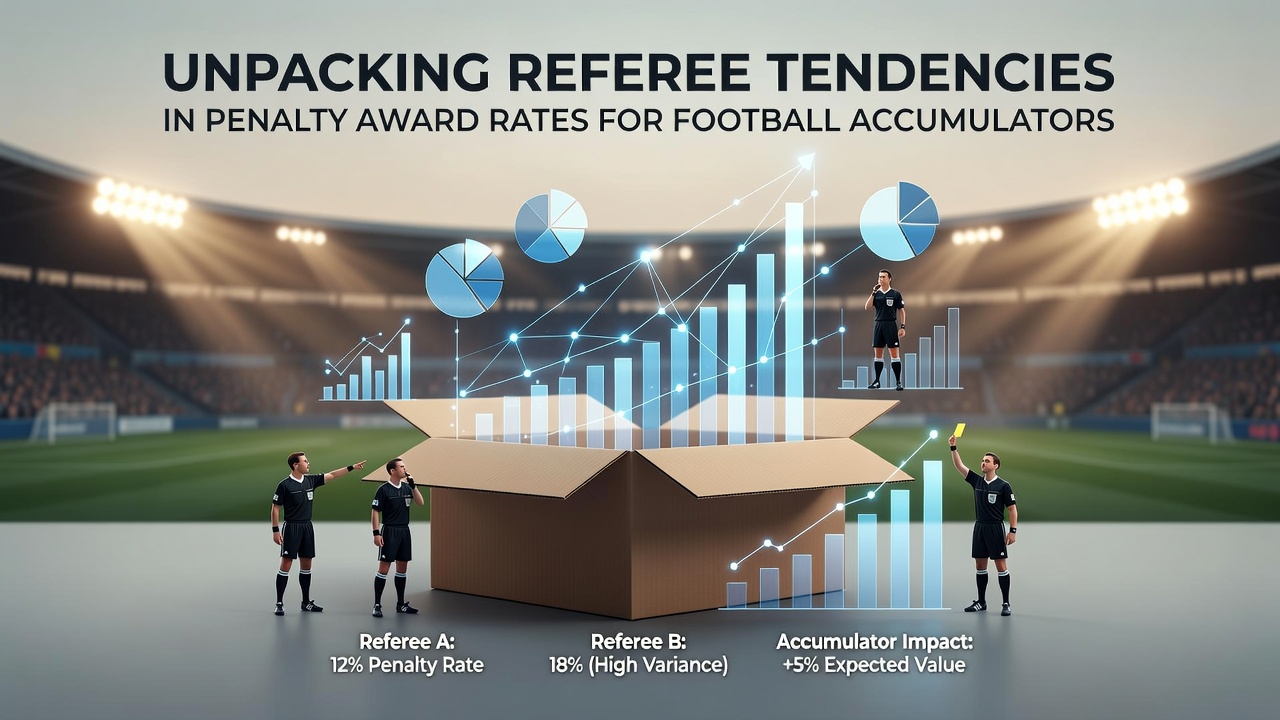
Football accumulators rely on multiple outcomes aligning across several matches, and penalty awards represent one variable that carries measurable weight in those calculations. League records show wide variation in how often different referees point to the spot, with some consistently higher than others across seasons. Analysts track these rates through official match data from competitions such as the Premier League, Bundesliga, and Serie A, where penalty frequency per game ranges from 0.18 to 0.42 depending on the official in charge.
League-Wide Penalty Statistics and Referee Distribution
Match logs compiled over multiple campaigns reveal that referees who average above 0.35 penalties per game appear more frequently in matches involving high-pressing teams that enter the box often. Those figures come from aggregated referee reports published by domestic federations. In contrast, officials averaging below 0.22 penalties per game tend to oversee matches where defensive blocks limit entry into dangerous areas. Bettors constructing accumulators examine these distributions when selecting fixtures, because a referee with an elevated rate can shift the probability profile for both teams involved.
European competitions supply additional layers of data. UEFA publishes annual referee performance summaries that include penalty counts alongside other disciplinary metrics. Observers note that referees moving between domestic leagues and European fixtures sometimes adjust their threshold for awarding spot kicks, producing measurable shifts in rates when the same official handles matches in different contexts.
Seasonal Trends and 2026 Adjustments
June 2026 brought updated VAR protocol clarifications from the International Football Association Board that emphasized clearer handball criteria and more consistent interpretation of shirt-pulling in the penalty area. Early season data from leagues adopting the revised guidelines indicate a modest increase in penalties awarded for blocking fouls, with some referees showing larger jumps than others. Accumulator builders monitor these early returns because the changes affect certain officials more than the overall average.
Research from the International Centre for Sports Studies examined five major European leagues across three seasons and identified clusters of referees whose penalty-award frequency remained stable within a narrow band regardless of team style or match importance. The study linked those stable patterns to lower variance in betting outcomes when accumulators included matches refereed by those officials.
Contextual Factors That Influence Award Rates
Match location, scoreline at the time of the incident, and time remaining all correlate with penalty decisions in historical datasets. Home teams receive slightly higher shares of penalties across most leagues, though the margin narrows when referees with lower overall rates officiate. Late-game situations produce more awards on average, particularly when the score is level or the trailing side applies sustained pressure.
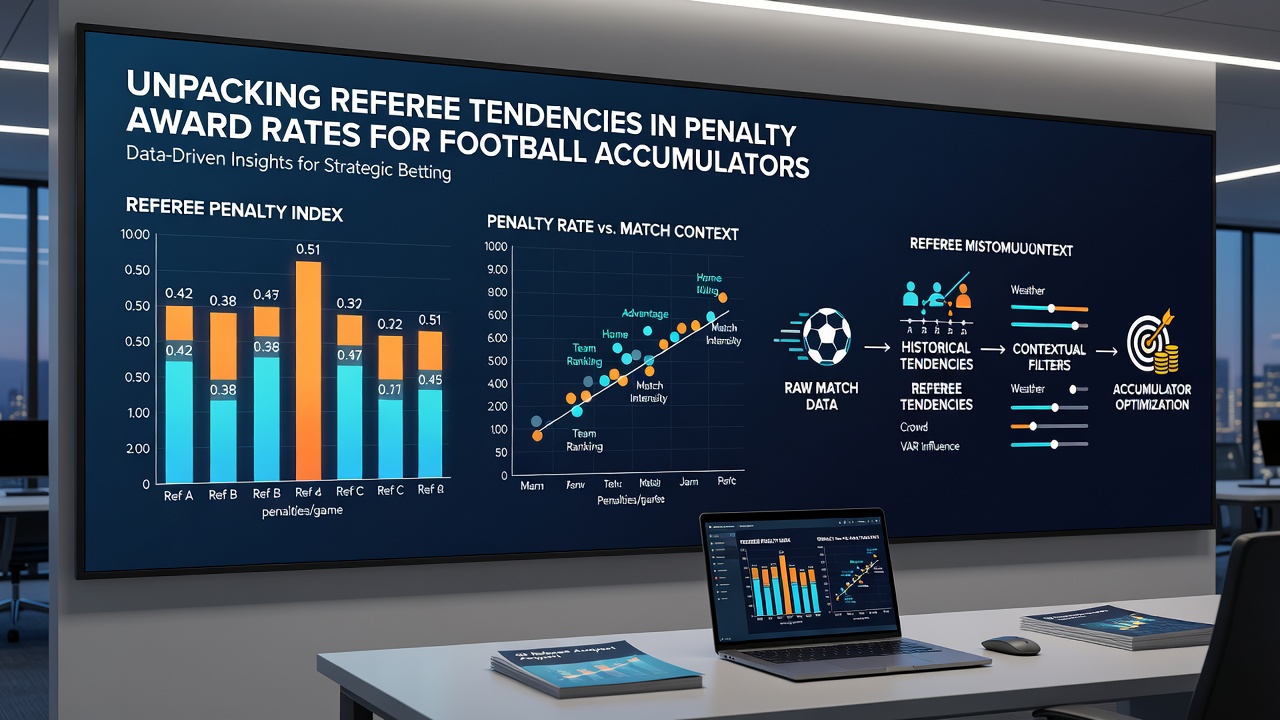
Stadium-specific data further refines these observations. Certain venues record higher penalty rates across multiple referees, suggesting that crowd proximity or pitch dimensions play a supporting role. When constructing accumulators that span several matches on the same day, bettors incorporate venue history alongside individual referee profiles to adjust expected frequencies.
Application to Accumulator Construction
Accumulator strategies incorporate referee tendencies by weighting selections according to historical rates rather than team form alone. A fixture featuring a referee with an above-average award rate may increase the perceived value of a both-teams-to-score leg or a win for the attacking side. Conversely, matches assigned to lower-rate officials sometimes favor under selections or draw outcomes in tight contests.
Performance tracking services now supply referee-specific dashboards that update after each round of fixtures. These tools allow comparison of current-season rates against multi-year baselines, highlighting officials whose tendencies have shifted. Data from the Australian Institute of Sport on decision-making under fatigue shows that referees covering consecutive high-intensity matches sometimes display altered foul thresholds, an observation that accumulator modelers have begun to test against football datasets.
Conclusion
Referee penalty tendencies supply one measurable input among many that shape accumulator probabilities. League records, competition summaries, and academic analyses together document consistent differences across officials while also noting the influence of match context and rule clarifications such as those implemented in 2026. Those who build accumulators integrate these patterns with team statistics and venue data to refine selections across multiple legs.