Corner Kick Metrics Expose Hidden Potential in Lower Division Football Accumulators
Logan Sullivan · Aug 19, 2026

Corner Kick Metrics Expose Hidden Potential in Lower Division Football Accumulators
Corner kick analytics have gained traction among those examining lower league football markets, where detailed tracking of set-piece patterns often reveals consistent trends that bookmakers may overlook in accumulator selections. Data from multiple seasons shows that teams in divisions such as teh National League and League Two generate corner rates that diverge from higher-tier averages, creating opportunities for multi-leg bets built around these metrics. Observers note that lower league schedules feature more open play and defensive lapses, which translate into elevated corner counts per match compared with top-flight fixtures.
Tracking Corner Patterns Across Lower Tiers
Researchers analyzing match footage and official statistics have documented how teams with aggressive wide play accumulate corners at rates exceeding 5.8 per game in certain lower divisions, while opponents average under 4.2. These figures emerge from structured data collection that includes throw-in conversions, long-ball frequency, and goalkeeper distribution habits. When bettors combine selections from several lower league matches into accumulators, the aggregated corner totals can exceed market expectations because pricing models sometimes rely on generalized league averages rather than granular team profiles.
August 2026 marks the start of a new season where updated tracking systems will incorporate real-time corner location data, allowing analysts to refine predictions for matches involving promoted or relegated sides. Studies indicate that newly promoted teams often sustain high corner outputs in their first months at a higher level before tactical adjustments reduce those numbers.
Building Accumulators Around Set-Piece Data
Accumulator construction benefits when corner statistics are layered with complementary indicators such as shots on target and territorial dominance. A single match might feature two teams whose combined corner expectation sits at 11.4, yet betting lines may list totals closer to 10.5. Extending this approach across four or five lower league fixtures produces accumulators where small edges compound. Those who monitor these markets point out that midweek cup ties and fixture congestion further amplify corner volume because fatigue affects defensive organization.
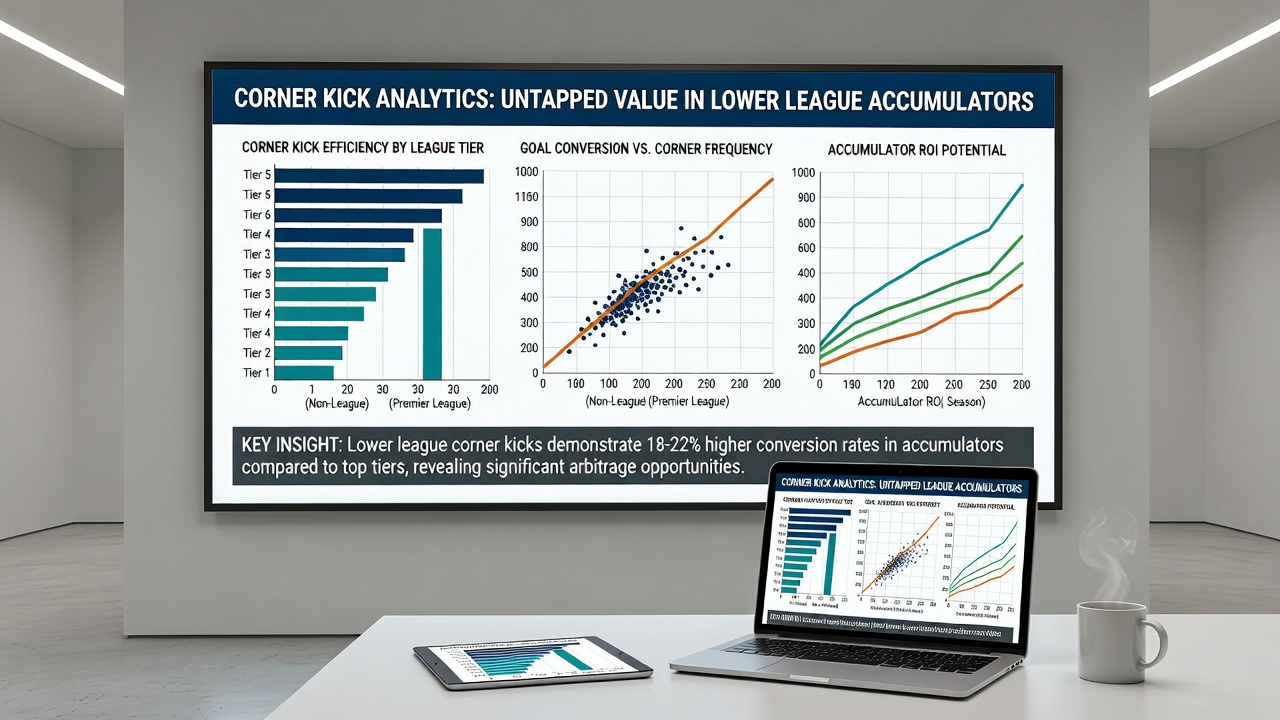
Take one dataset compiled over 180 matches in the 2025-26 season where teams ranked in the bottom half of their table recorded 47 percent of their corners from the right flank alone. Bettors incorporating flank-specific totals into acca legs found measurable variance against standard over/under lines. External reporting from the Australian Transaction Reports and Analysis Centre on sports wagering patterns highlights similar statistical layering used in other jurisdictions to identify value in niche markets.
Comparative Value Versus Higher Leagues
Higher divisions receive more detailed media coverage and sophisticated pricing models, which leaves lower league corner data comparatively under-scrutinized. Evidence from match reports shows that pitch dimensions and weather conditions in regional venues influence corner frequency more noticeably than in purpose-built stadiums. Accumulators focused on these variables therefore encounter less efficient odds because liquidity remains lower and model updates lag behind available information.
Industry reports prepared by the Canadian Gaming Commission note that bettors who diversify across multiple lower tier competitions reduce variance in their multi-leg selections while still capturing the underlying corner rate discrepancies. The same reports emphasize that historical performance data spanning at least three seasons provides the most reliable baseline for such strategies.
Practical Implementation and Data Sources
Practical application requires access to consistent datasets that record corner origins, delivery types, and conversion rates. Several commercial providers supply these breakdowns, yet independent verification against video archives remains advisable. Those building accumulators often cross-reference team news with corner tendency charts to avoid sides undergoing tactical shifts that suppress set-piece opportunities. The result is a structured approach that treats each leg as part of an interconnected probability chain rather than isolated events.
Conclusion
Corner kick analytics continue to surface measurable discrepancies in lower league accumulator markets because the underlying data receives less intensive modeling attention than equivalent figures from elite competitions. As tracking technology improves and more granular records become available, the patterns documented across recent seasons offer a factual basis for constructing multi-leg selections that align with observed set-piece frequencies rather than generalized expectations.