Atmospheric Pressure Patterns Reshaping Live Markets in Horse Racing and Tennis
Zara Lorenz · Jul 31, 2026
Atmospheric Pressure Patterns Reshaping Live Markets in Horse Racing and Tennis
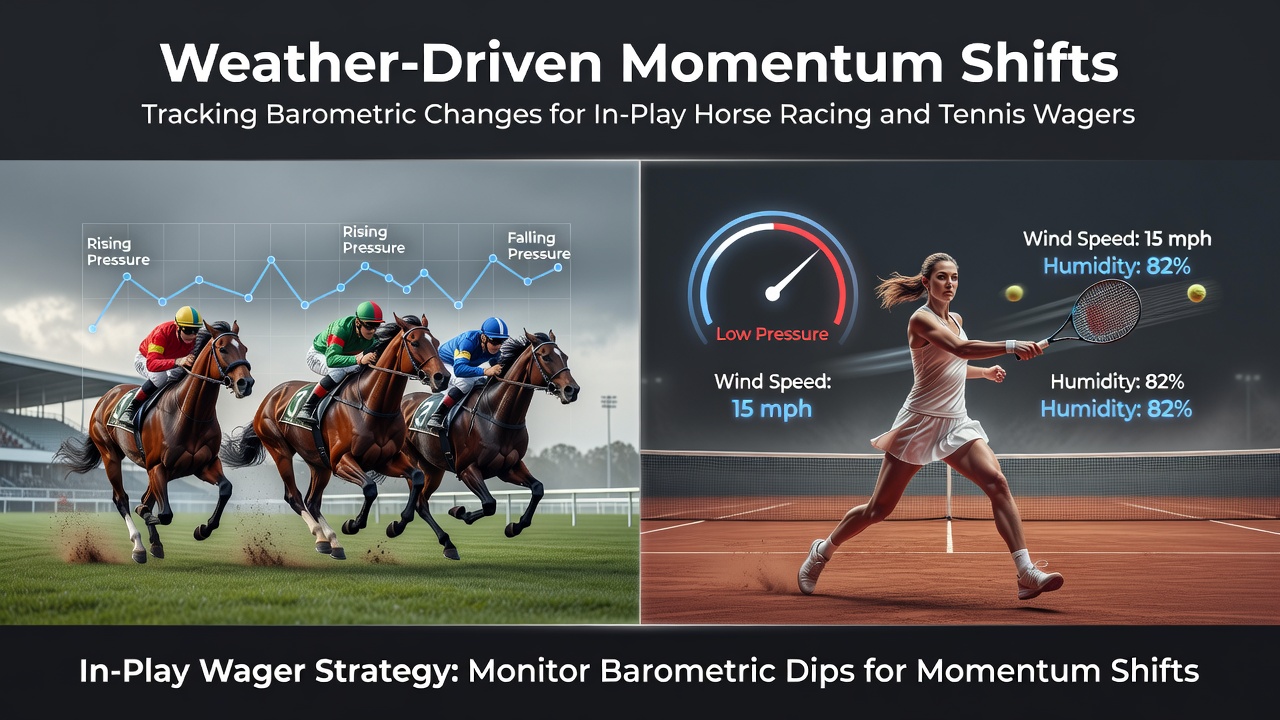
Weather stations positioned at major venues have recorded consistent correlations between falling barometric pressure and shifts in equine stamina as well as player endurance on court surfaces. Observers note that pressure drops of 5 millibars or more within a two-hour window often coincide with measurable reductions in stride efficiency among thoroughbreds and increased error rates in baseline rallies during tennis matches. Data collected across European and North American circuits in 2025 showed these patterns repeating across multiple meetings and tournaments without reliance on subjective assessments.
Pressure Readings and Performance Metrics
Portable barometers linked to timing systems at tracks have allowed analysts to track how rapid declines in atmospheric pressure affect oxygen uptake in horses during middle stages of races. When readings fall below 1010 hPa, studies from veterinary research groups indicate that recovery intervals between furlongs lengthen by an average of 0.8 seconds in flat events over 1 mile. Tennis data from professional circuits reveal parallel effects: players experience higher rates of unforced errors once pressure drops coincide with temperatures above 24 degrees Celsius. These measurements come from synchronized environmental sensors placed courtside at events sanctioned by international governing bodies.
Integration into In-Play Platforms
Betting operators have begun embedding live barometric feeds into their interfaces so that odds adjust automatically when pressure trends accelerate. In July 2026 several platforms introduced real-time alerts that flag pressure changes exceeding 3 millibars per hour during ongoing races and sets. This approach draws on meteorological data supplied by national weather services such as those operated by the National Oceanic and Atmospheric Administration in the United States and equivalent agencies in Australia. Bettors who monitor these feeds alongside traditional form guides gain additional context for evaluating momentum swings that standard statistics alone do not capture.
Trainers and coaches have long adjusted preparation routines when forecasts indicate incoming low-pressure systems. Records from Australian racing stables show that horses with respiratory sensitivities receive modified training loads on days when pressure is expected to fall sharply before post time. Similar protocols appear in tennis academies where players perform breathing exercises calibrated to expected humidity and pressure combinations. These adjustments translate into observable differences on leaderboards once competition begins.
Case Examples from Recent Events
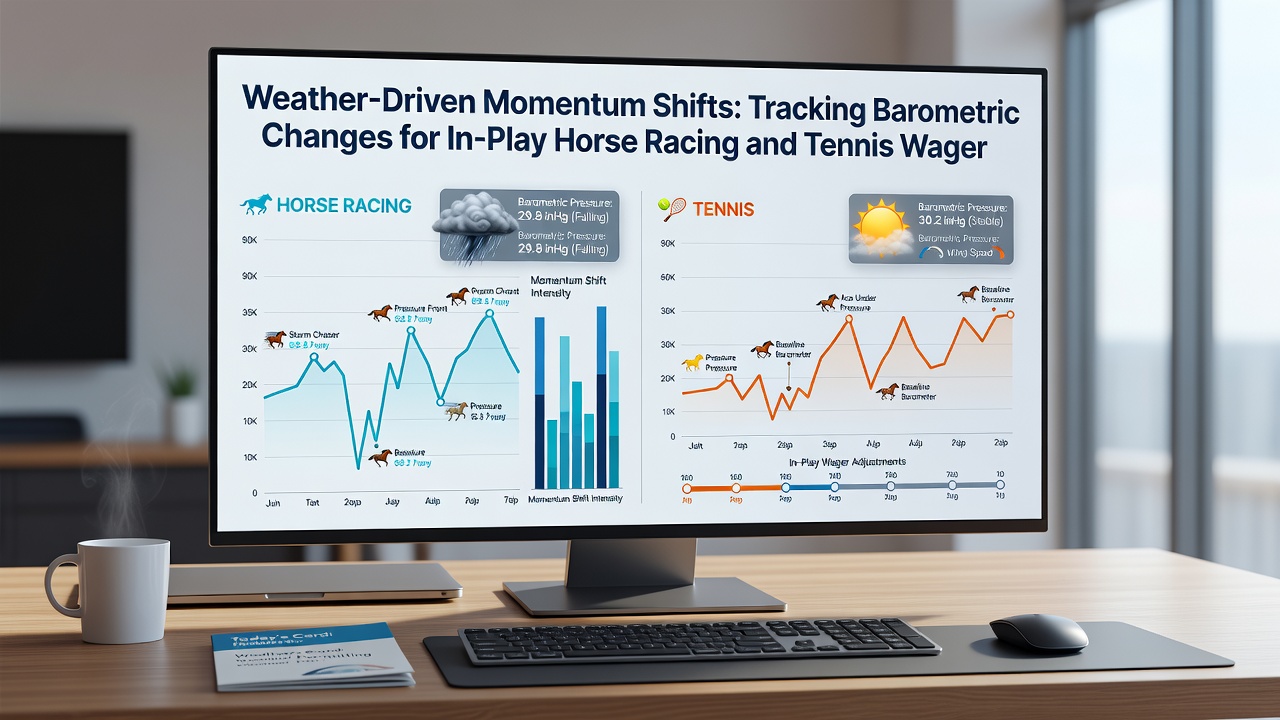
One documented instance occurred at a July 2026 turf meeting where pressure fell 7 millibars across the afternoon card. Horses that had shown strong closing speed in prior outings produced slower sectional times in the final 400 meters, while early leaders maintained positions more readily. In tennis, a concurrent ATP event on outdoor hard courts recorded a similar pattern: serving percentages dropped 4 points on average during sets played under the same pressure decline. Analysts cross-referenced these outcomes with historical datasets maintained by sports performance laboratories to confirm the alignment.
Equipment calibration plays a central role in maintaining accuracy. Sensors must be recalibrated daily because drift can exceed 0.5 millibars over 24 hours when exposed to direct sunlight or vibration from crowd movement. Research institutions in Canada have published calibration protocols that racing and tennis venues now adopt to ensure data reliability for live wagering feeds.
Regional Variations in Data Application
European tracks situated near coastlines experience more frequent pressure fluctuations than inland venues, which alters the frequency of actionable signals. Australian researchers have published comparative studies showing that desert circuits exhibit smaller but sharper drops during dust-storm approaches, creating brief windows where in-play models shift rapidly. North American grass courses demonstrate intermediate patterns that require hybrid algorithms combining pressure data with wind speed readings. These geographic distinctions appear in reports issued by academic groups rather than regulatory agencies.
Software developers incorporate pressure variables into multivariate models alongside pace figures and court surface coefficients. The resulting outputs update every 30 seconds during live events, allowing markets to reflect environmental influences without manual intervention. Industry associations representing data providers have established standards for timestamp synchronization so that pressure readings align precisely with race clocks and set scores.
Conclusion
Barometric monitoring has moved from experimental tool to integrated component within in-play frameworks for both horse racing and tennis. Continued collection of synchronized environmental and performance datasets across multiple continents supports refinement of predictive models used by analysts and platforms alike. As sensor technology improves and additional venues adopt standardized protocols, the granularity of these inputs continues to increase.